Digital Causality Lab
Kick-off Data Product Phase
Digital Causality Lab
About the Digital Causality Lab
-
Digital Causality Lab (1 SWS, Oliver Schacht)
- New - replaces the former tutorial
- Focus on practice, implementation and tools
- Data Literacy skills
- Independent learning and collaboration
- Teaching Phase and Data Product Phase
- Wednesday, 2 pm and 3 pm, WiWi 2079
- Questions to oliver.schacht@uni-hamburg.de
Digital Causality Lab
1. Teaching Phase (done)
- Thorough introduction of tools for causal analysis and data literacy
- Recap: Statistics
- Introduction to R
- Introduction to GitHub and Git
- Causal Inference in Practice
- Data Products with Quarto
- Week 1 to 4
Digital Causality Lab
2. Data Product Phase
- Independent development of a data product on causality
- Solve case study in a group of students
- Creative solution: It’s all up to you, from the concept to the implementation
- Three milestones: 1. Concept - 2. Protoype, 2. Final
- Week 4/5 to week 13
Digital Causality Lab
2. Data Product Phase
- Case Study Topics
- Illustration of causal phenomena
- Graphical approaches
- Real-data examples
- Illustration of estimation approaches
- Causal estimation in practice
- List of case studies available on GitHub
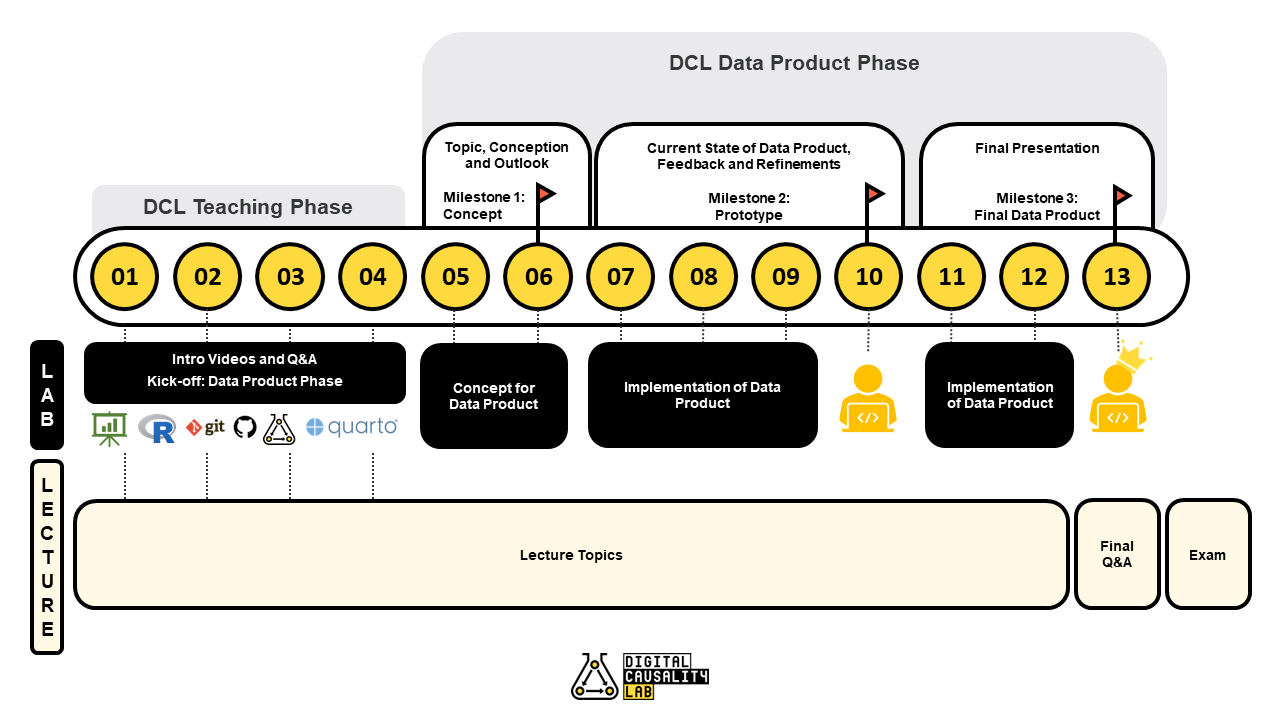
Outlook
Plan for the course
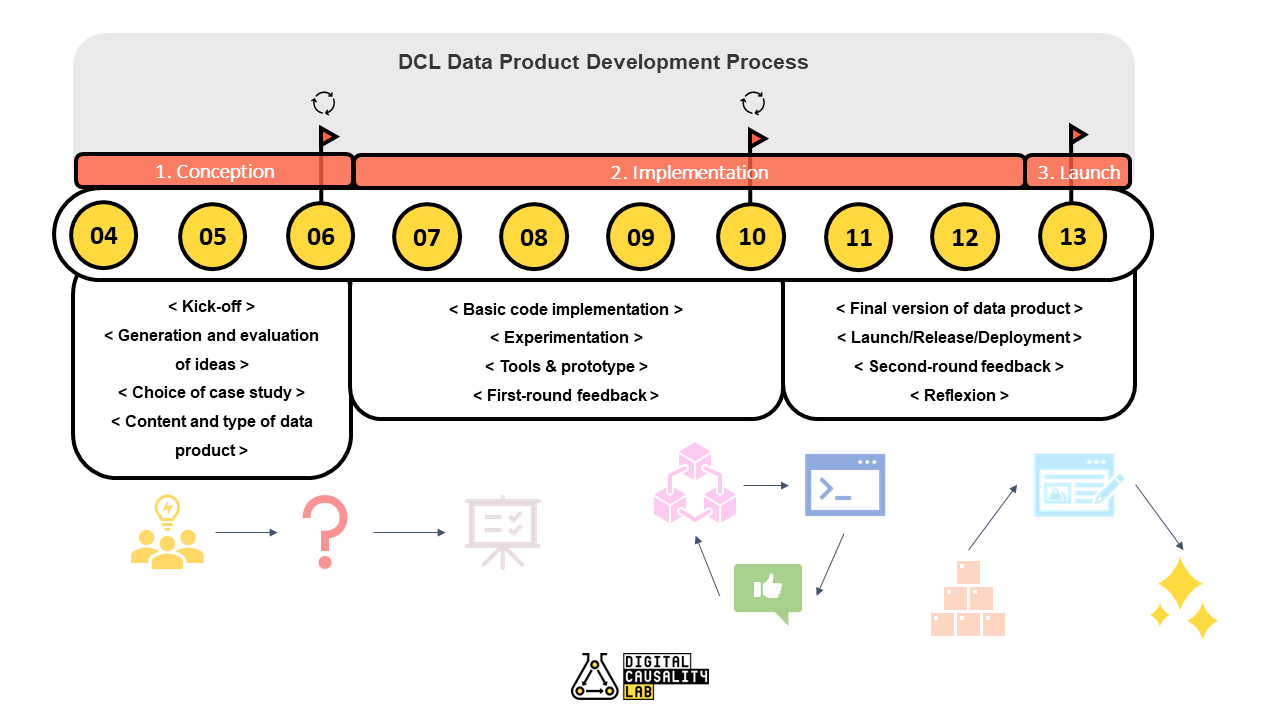
Outlook
Plan for the DCL data product phase
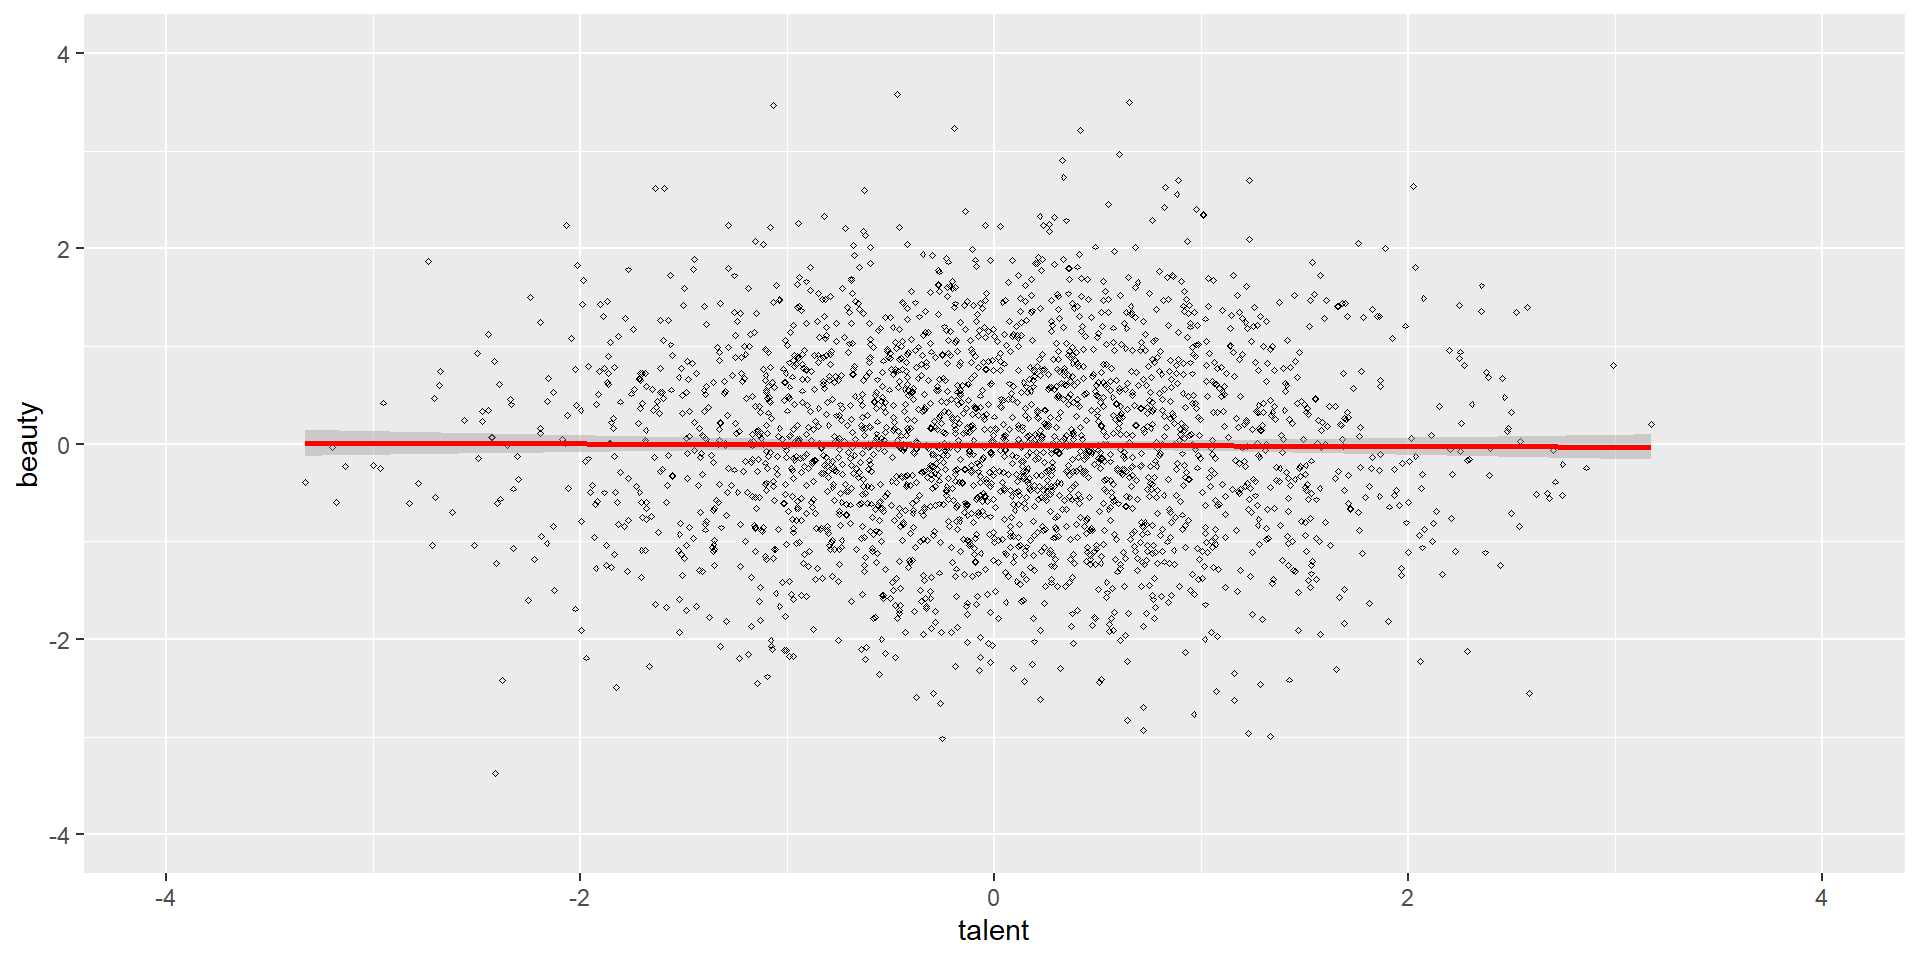
Workflow: Example Data Product
2. Implementation
- Collider bias example:
- Visualization with
ggplot
- Visualization with